 In preparation for my return home from Florida, I have spent the past few weeks studying how to improve weather analysis. We have built up a lot of knowledge over the past few years. The site of Morgan's Cloud has mainly given us new insights on how to analyze weather in a more structured way.
A good tip is to distinguish between strategic and tactical weather analysis. With strategic weather analysis you look 14 days ahead and only on the main lines. With tactical weather analysis you only look 5 days ahead and in much more detail. Both analyses are important for the preparation of multi-day trips (what is a good time to leave?) and during the trips themselves (do we keep course or is it necessary to find a sheltered harbour sooner or change course?). But also during short trips along the coast (what are suitable days for sailing? which harbours/anchorage places are safe and which are not?).
Tactical Weather Analysis
This analysis looks ahead up to 5 days. Longer than 5 days ahead the weather is too unreliable for a smaller specific area.
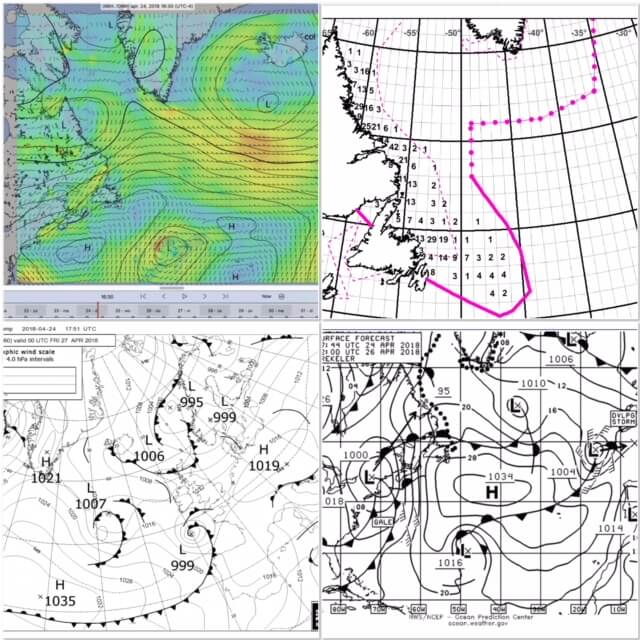
- Step 1 is the retrieval of weather maps. Along the east coast of America we pick up the Boston weather maps. Back near Europe we use the British Bracknell maps (like Henk Huizinga van Zilt Meteo does). There are also maps available with information about ice formation (in Canada and Greenland) and the course of hurricanes (as soon as the hurricane season has started). See below for more information to retrieve these maps by mail.
- Step 2 is to analyze the weather charts by running through them a few times in chronological order. The aim is to get a feel for weather patterns in a large area and how this is going to change over the next four days. Where are the high and low pressure areas and how do they move? What 'dangerous' weather is developing outside our immediate vicinity? If you do this more often you will learn to recognize patterns.
- Step 3 is to retrieve a gribfile with detailed information of only the small area you are in (max 5 days ahead, 3 hour steps, 0.25 degree accuracy, with wind/rain/pressure/waves and gust). Morgans Cloud tipped LuckGrib as a viewer and it seems to work fine. It is also possible to use ZyGrib or another viewer.
- Step 4 is to analyze the grib file and compare it with the weather charts. Based on this we can answer the questions as mentioned above in the introduction.
- Step 5 is to write down the prediction in steps of 6 hours and four days ahead. We do this in a spreadsheet. This makes it easier to remember and makes it easier to make a comparison with the predictions of the previous days.
- Step 6 is the retrieval of weather information from text files written by meteorologists. For many areas it is possible to retrieve such a text file by mail. This information is also available via radio broadcasts and Navtex. See below for more information on how to retrieve these text files via e-mail. This is deliberately the last step and only for double-checking your own analyses. If all goes well we have already made the right analysis ;-).
Strategic weather analysis
This analysis looks 14 days ahead, the maximum number of days that gribfiles are available. It is not necessary to do this every day as long as the weather is stable. For example, every 2-3 days and more often if the weather is more unstable. It is important not to do this analysis until the tactical weather analysis has been completed.
- Step 1 is to retrieve a gribfile for a large area (1 degree accuracy, steps of 12 hours, 14 days ahead, with wind/press/rain). So we can see what is happening further away from us. This file will be about 250kB and download via Iridium will take about 45 min, but that doesn't matter because we have the time and an unlimited data subscription.
- Step 2 is to analyze the gribfile by running through it several times. With the aim of answering the following questions. Which path do the low pressure systems follow? How strong are they? Is there a tendency for rapid intensification? Are there high pressure systems? How fast do they move? How stable is the Azores high and where is it? The aim is to analyse patterns and not to use them as tactical weather analysis.
Retrieval of information by mail
This can be done by sending an email to query@saildocs.com.
The title doesn't have to say anything. Include the following 'Send' lines in the body.
Boston weather charts
These are five maps of about 26kb in size that cover respectively current weather east atlantic, current weather west atlantic, entire atlantic in 24 hours, entire atlantic in 48 hours and entire atlantic in 96 hours.
Send PYAA11.TIF
Send PYAA12.TIF
Send PPAE10.TIF
Send QDTM10.TIF
Send PWAM99.TIF
UK Bracknell weather charts
These are seven tickets of about 20kb for current, 24 hours, 48 hours, 60 hours, 72 hours, 96 hours and 120 hours respectively.
Send PPVA89.TIF
Send PPVE89.TIF
Send PPVI89.TIF
Send PPVJ89.TIF
Send PPVK89.TIF
Send PPVM89.TIF
Send PPVO89.TIF
Tropical cyclone / tropical depression / tropical storm / hurricane
Send PWEK11.TIF (16kb)
Ice chart
Send PIEA88.TIF (271kb)
Bermuda cards
Handy for near Bermuda, the entire south east coast of America and on the way from Bermuda to the Azores. It's four consecutive days. The big traffic jams are 450kB, the small ones (also easy to read) are 50kB.
Send http://www.weather.bm/images/marineChart/Latest/Large/_chartLarge36.jpg
Send http://www.weather.bm/images/marineChart/Latest/Large/_chartLarge60.jpg
Send http://www.weather.bm/images/marineChart/Latest/Large/_chartLarge84.jpg
Send http://www.weather.bm/images/marineChart/Latest/Large/_chartLarge108.jpg
Send http://www.weather.bm/images/marineChart/Latest/Small/_chartSmall36.gif
Send http://www.weather.bm/images/marineChart/Latest/Small/_chartSmall60.gif
Send http://www.weather.bm/images/marineChart/Latest/Small/_chartSmall84.gif
Send http://www.weather.bm/images/marineChart/Latest/Small/_chartSmall108.gif
Satellite image (east coast US)
Send evnt99.jpg (264kb)
Grib file retrieval for tactical analysis
First delineate area with N and W lines.
Resolution is 0.25
Steps from 3 hours to 120 hours
Pick up Wind, Press, Rain, Gust and Waves
Speed of the boat
Direction of the boat
With those last two you get a gribfile that shifts the area according to speed and direction of the boat.
Send gfs:xxN,yyN,zzW,ttW|.25,.25|0.3.6..120|WIND,PRESS,RAIN,GUST,WAVES|WIND|7.0.080
Request Gribfiles for strategic analysis
First delineate area with N and W lines.
Send gfs:xxN,yyN,zzW,ttW|1,1|0,12..336|WIND,PRESS,RAIN
Messages written by meteorologists
Many of these types of messages are available in small text files. If you have the internet address you can send it to saildocs and you will get the written text back in the mail. The names of the text files along the east coast of the USA can be found at the website of NOAA.
Two examples:
Text file for the entire Atlantic
Send http://tgftp.nws.noaa.gov/data/forecasts/marine/high_seas/north_atlantic.txt
Text file for a certain area along the US east coast
Send ftp://tgftp.nws.noaa.gov/data/forecasts/marine/offshore/am/amx115.txt